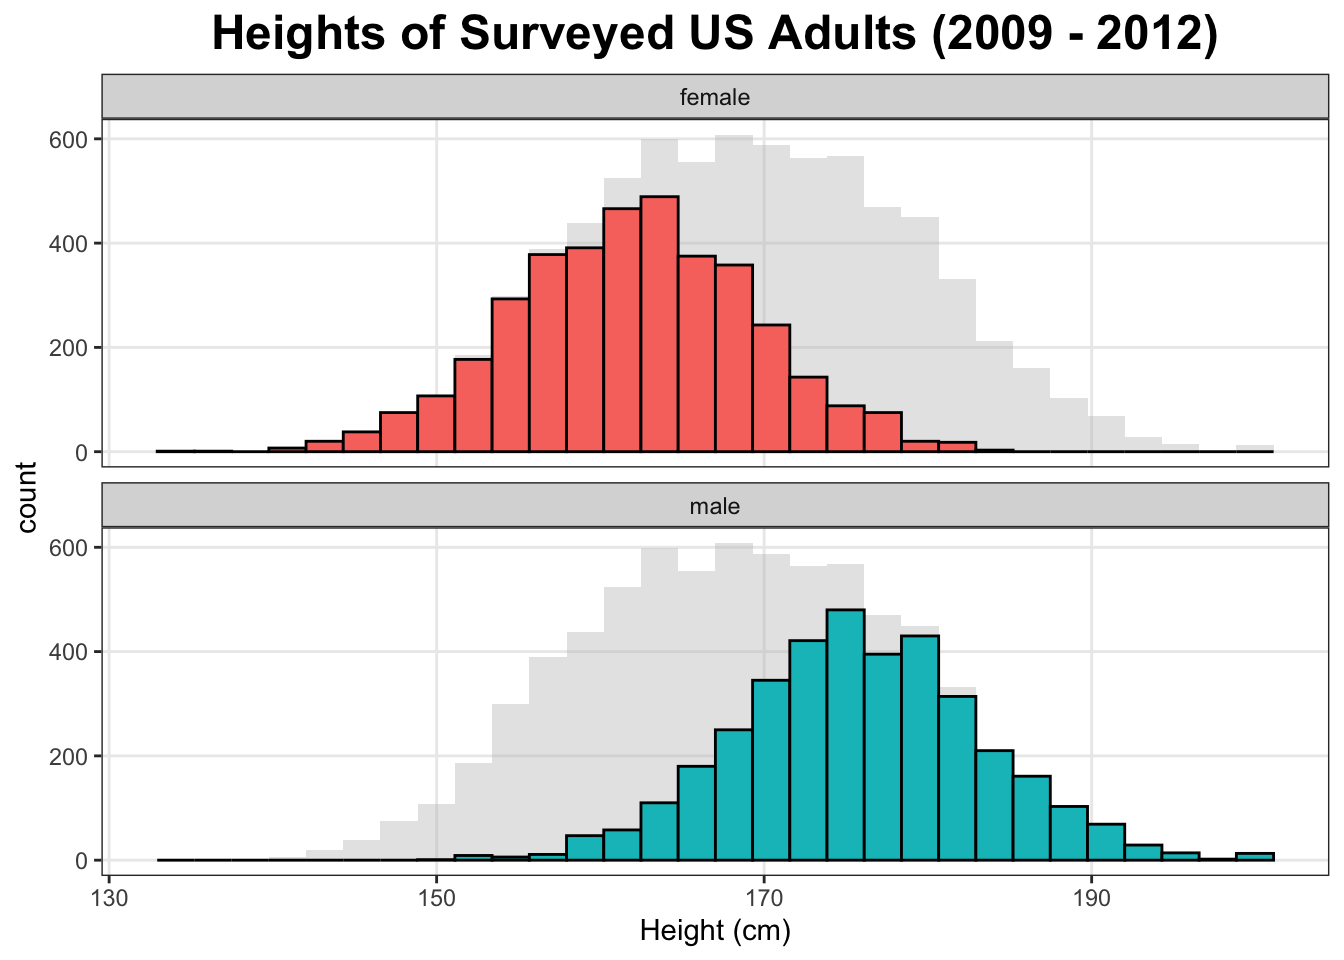
Histogram of NHANES Survey respondents

Data
This plot uses the NHANES data set contained in the NHANES package available on CRAN. Along with many other recorded variables it contains the heights of individuals surveyed between 2009 and 2012.
Code for plot
This code uses geom_histogram. To get the background histogram, for the entire population, another data frame is used which is the original data frame without the Gender variable. Thus there are two geom_histogram geometries added to this plot.
library(NHANES)
library(dplyr)
library(ggplot2)


NHANES_adults <- filter(NHANES, Age >= 18)
NHANES_bg <- select(NHANES_adults, -Gender)


nhanes_height_plot <- ggplot(data = NHANES_adults, aes(x = Height)) +
  geom_histogram(data = NHANES_bg, fill = "grey", alpha = .4) +
  geom_histogram(mapping = aes(fill = Gender), colour = "black") +
  facet_wrap(~ Gender, ncol = 1) +
  guides(fill = FALSE) +  # to remove the legend
  theme_bw() + xlab("Height (cm)") + ggtitle("Heights of Surveyed US Adults (2009 - 2012)")  +
  theme(panel.grid.minor = element_blank(),
        plot.title = element_text(size = 18, face = "bold", hjust = 0.5))


nhanes_height_plot