NY Mets 2019 Season

Data
This plot uses the nym data frame of the gcubed package. The original data was obtained from Baseball Reference.
library(gcubed)
head(nym)
## # A tibble: 6 x 26
## `Gm#` Date Tm HomeAway Opp WL wo R RA Inn `W-L`
## <dbl> <chr> <chr> <chr> <chr> <chr> <chr> <dbl> <dbl> <dbl> <chr>
## 1 1 Thur… NYM @ WSN W <NA> 2 0 NA 1-0
## 2 2 Satu… NYM @ WSN W <NA> 11 8 NA 2-0
## 3 3 Sund… NYM @ WSN L wo 5 6 NA 2-1
## 4 4 Mond… NYM @ MIA W <NA> 7 3 NA 3-1
## 5 5 Tues… NYM @ MIA W <NA> 6 5 NA 4-1
## 6 6 Wedn… NYM @ MIA W <NA> 6 4 NA 5-1
## # … with 15 more variables: Rank <dbl>, Win <chr>, Loss <chr>, Save <chr>,
## # Time <drtn>, `D/N` <chr>, Attendance <dbl>, Streak <chr>, `Orig.
## # Scheduled` <lgl>, win_updown <dbl>, games_updown <dbl>, played <dbl>,
## # wins <dbl>, tot_played <dbl>, tot_wins <dbl>Code for plot
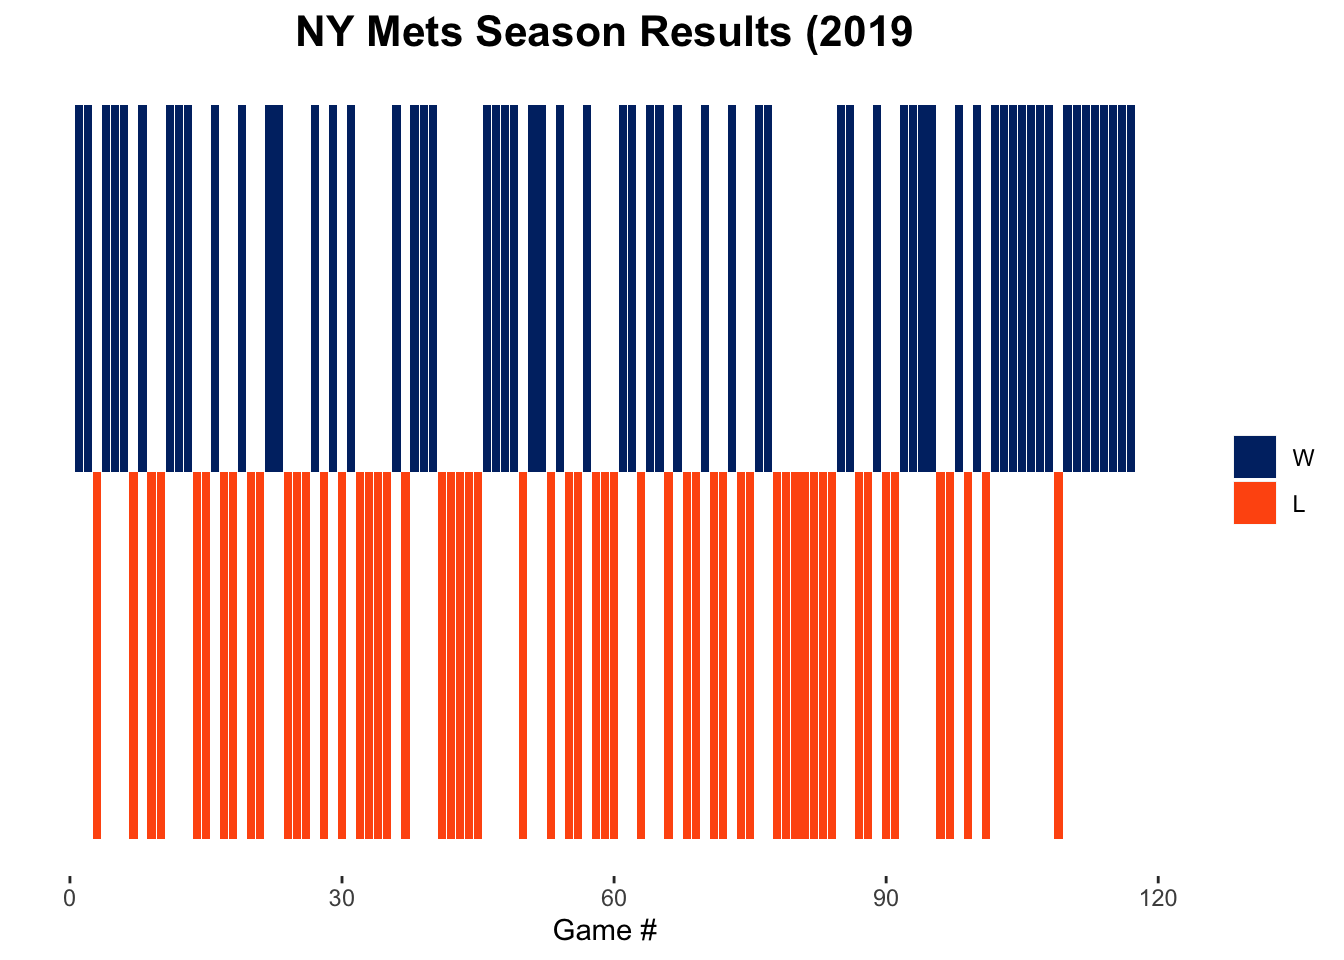
library(ggplot2)

mets_plt <- ggplot(nym, aes(x = `Gm#`, y = ifelse(WL == "W", 1,-1), fill = WL) ) +
  geom_bar(stat = "identity") +
  scale_fill_manual(values = c("#FF5910", "#002D72")) +
  xlab("Game #") +
  ggtitle("NY Mets Season Results (2019") +
  theme(panel.background = element_blank(),
        axis.title.y = element_blank(),
        legend.title = element_blank(),
        axis.text.y = element_blank(),
        axis.ticks.y = element_blank(),
        plot.title = element_text(size = 16, face = "bold", hjust = 0.5)) +
  guides(fill = guide_legend(reverse=TRUE))

mets_plt