Chicago Employee Salaries

Data
This plot uses the chi_emps data set of the gcubed package. The original source of the data is the City of Chicago’s Data Portal5.
First filter the data down to only the salaried employees.
library(gcubed)
library(dplyr)
df <- filter(chi_emps, SalHour == "Salary")
dim(df)
## [1] 25741 8Code for plot
library(ggplot2)

chi_emps_hist <- ggplot(df, aes(x = AnnualSalary)) +
  geom_histogram(fill = I("royalblue"), colour = I("black"), bins = 50) +
  scale_y_continuous(label = comma) +
  scale_x_continuous(label = comma) +
  xlab("Annual Salary ($)") +
  ylab("No. of Employees") +
  ggtitle("Annual Salaries of Chicago City Employees (2019)") +
  theme(panel.grid.minor = element_blank(),
        plot.title = element_text(size = 18, face = "bold", hjust = 0.5))
chi_emps_hist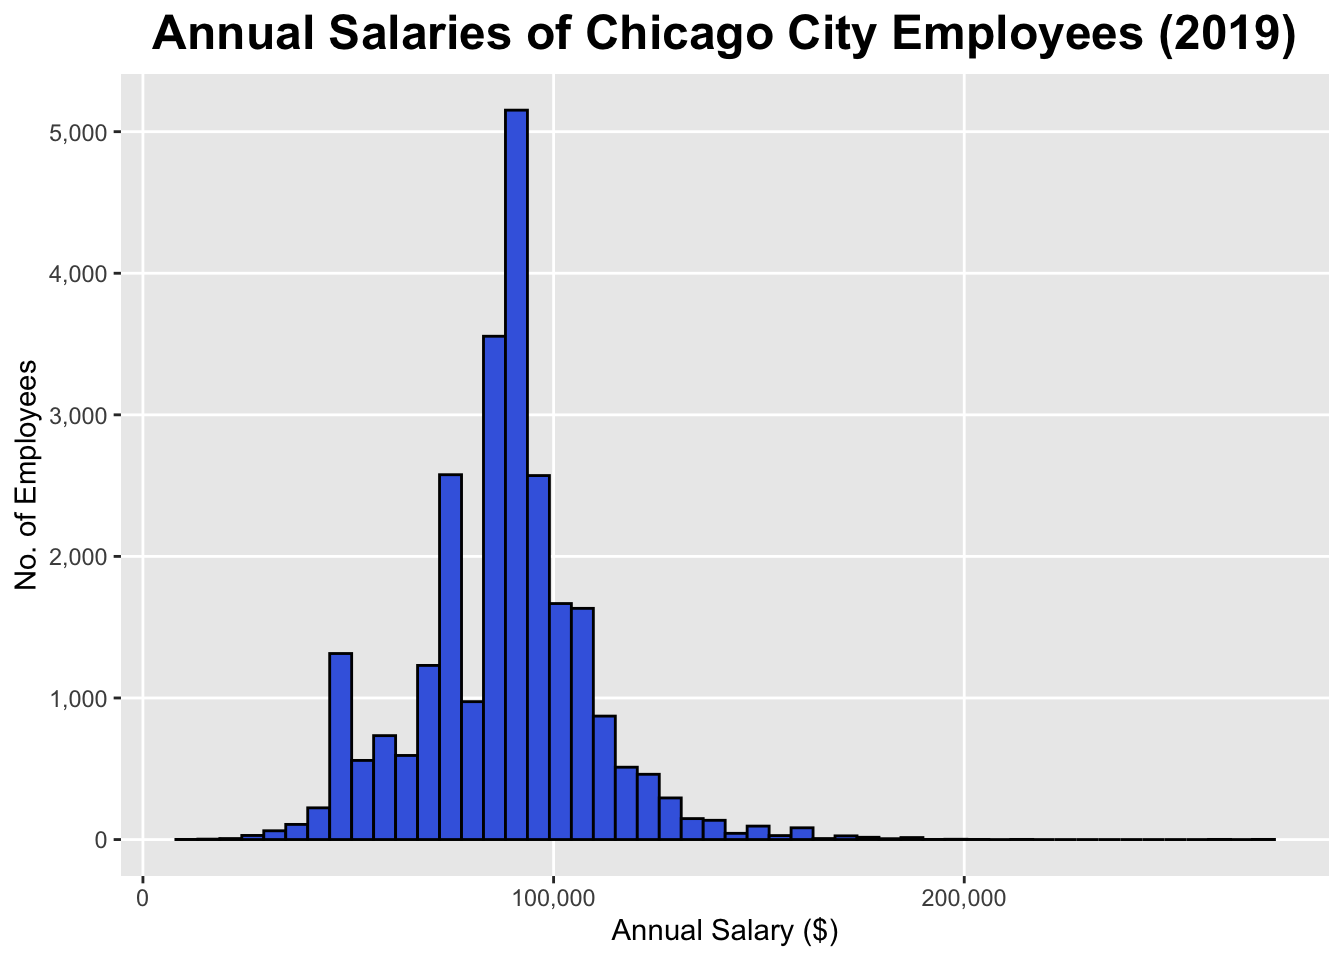
The data was current as of July 2019↩