LeBron James Career Minutes

Data
This plot uses the lebron_mp data frame from the gcubed library. This data frame has columns MPR and MPP for minutes played by LeBron James during the regular season and playoffs respectively of the corresponding season.
The original data source is Basketball Reference.1
library(gcubed)
head(lebron_mp)
## # A tibble: 6 x 3
## Season MPR MPP
## <chr> <dbl> <dbl>
## 1 2003-04 3122 0
## 2 2004-05 3388 0
## 3 2005-06 3361 604
## 4 2006-07 3190 893
## 5 2007-08 3027 552
## 6 2008-09 3054 580Code for plot
First, add columns for cumulative career minutes for both playoffs and the regular season.
library(dplyr)

df <- mutate(lebron_mp, Playoffs = cumsum(MPP),
                    `Reg Season` = cumsum(MPR))
head(df)
## # A tibble: 6 x 5
## Season MPR MPP Playoffs `Reg Season`
## <chr> <dbl> <dbl> <dbl> <dbl>
## 1 2003-04 3122 0 0 3122
## 2 2004-05 3388 0 0 6510
## 3 2005-06 3361 604 604 9871
## 4 2006-07 3190 893 1497 13061
## 5 2007-08 3027 552 2049 16088
## 6 2008-09 3054 580 2629 19142library(tidyr)
df <- gather(df, key = RegPlayoffs, value = MP, Playoffs:`Reg Season`)
head(df)## # A tibble: 6 x 5
## Season MPR MPP RegPlayoffs MP
## <chr> <dbl> <dbl> <chr> <dbl>
## 1 2003-04 3122 0 Playoffs 0
## 2 2004-05 3388 0 Playoffs 0
## 3 2005-06 3361 604 Playoffs 604
## 4 2006-07 3190 893 Playoffs 1497
## 5 2007-08 3027 552 Playoffs 2049
## 6 2008-09 3054 580 Playoffs 2629First version of the plot:
library(ggplot2)
library(scales)

lbj_plt <- ggplot(df, aes(x = Season, y = MP, fill = RegPlayoffs)) +
  geom_bar(stat = "identity") +
  scale_fill_manual(values = c("#D9717D", "#4DB6D0")) +
  scale_y_continuous(label=comma, limits = c(0,70000)) +
  theme_bw() + #change the background colour to white
  theme(panel.grid.major = element_blank(), panel.grid.minor = element_blank(),
        axis.text.x = element_text(angle = 90),
        plot.title = element_text(size = 18, face = "bold", hjust = 0.5),
        legend.title = element_blank()
        )+
  ylab("Cumulative Minutes") +
  ggtitle("LeBron James Career Minutes Played")

lbj_plt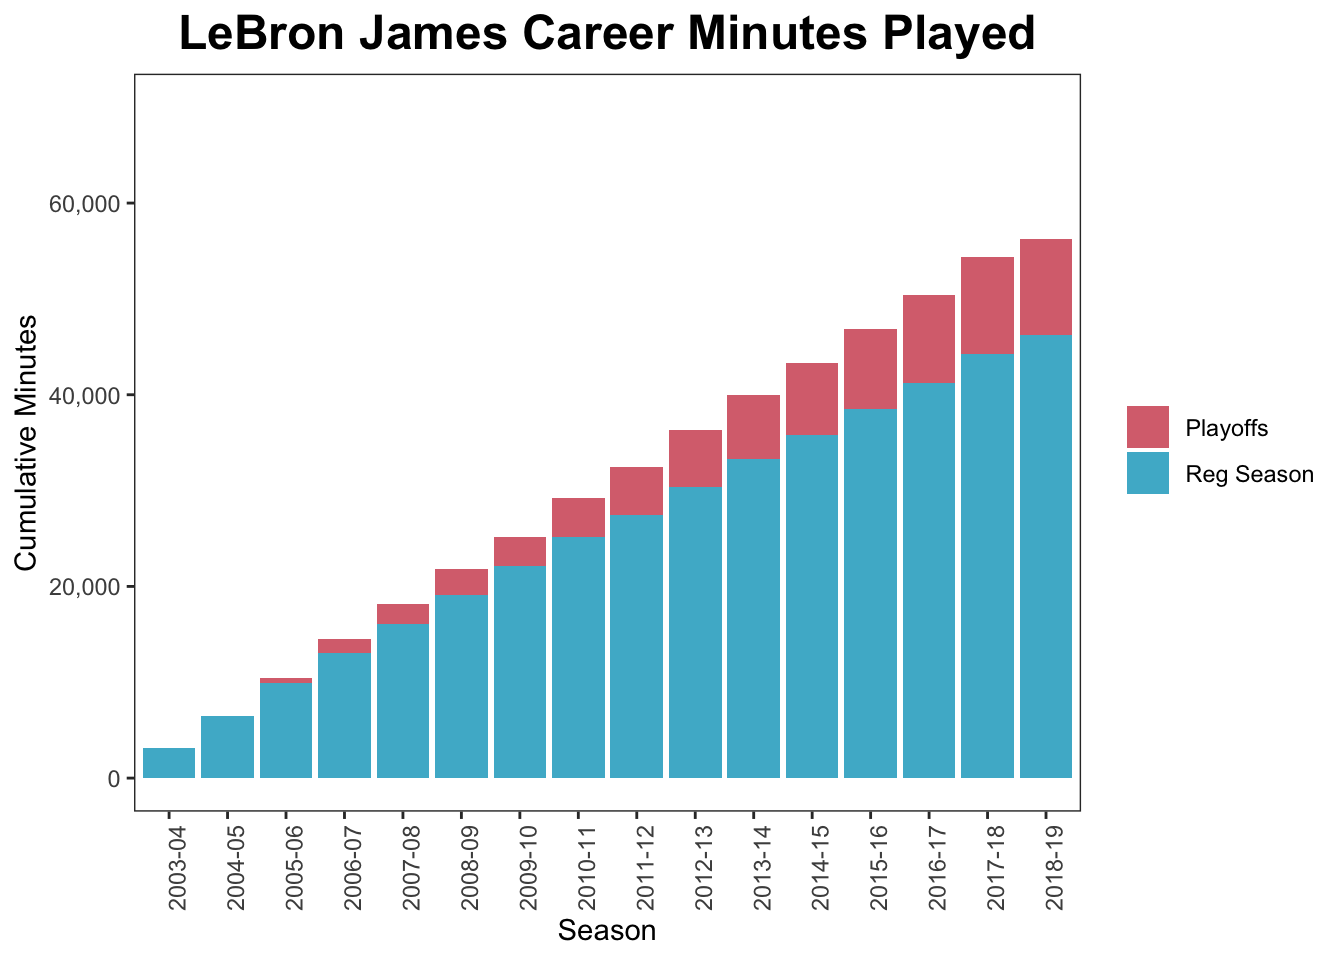
Adding annotations for other significant NBA players:
lbj_plt <- lbj_plt +
  geom_segment(x = 12, xend = 17, y=66297, yend = 66297, linetype="dashed") +
  geom_text(aes(14,66297,label = "Kareem Abdul-Jabbar", vjust = -1)) +
  geom_segment(x = 8, xend = 17, y = 62759, yend = 62759, linetype="dashed") +
  geom_text(aes(9,62759,label = "Karl Malone", vjust = -1)) +
  geom_segment(x = 5, xend = 17, y = 57278, yend = 57278, linetype="dashed") +
  geom_text(aes(6,57278,label = "Kobe Bryant", vjust = -1)) +
  geom_segment(x = 5, xend = 17, y = 56738, yend = 56738, linetype="dashed") +
  geom_text(aes(6,56738,label = "Tim Duncan", vjust = 1.5)) +
  geom_segment(x = 1, xend = 17, y = 50016, yend = 50016, linetype="dashed") +
  geom_text(aes(2.5,50016,label = "Shaquille O'Neal", vjust = -1)) +
  geom_segment(x = 1, xend = 17, y = 48485, yend = 48485, linetype="dashed") +
  geom_text(aes(2.4,48485,label = "Michael Jordan", vjust = 1.5)) +
  geom_segment(x = 7.2, xend = 17, y = 41329, yend = 41329, linetype="dashed") +
  geom_text(aes(8,41329,label = "Larry Bird", vjust = -1)) +
  geom_segment(x = 7.2, xend = 17, y = 40783, yend = 40783, linetype="dashed") +
  geom_text(aes(8.5,40783,label = "Magic Johnson", vjust = 1.5))

lbj_plt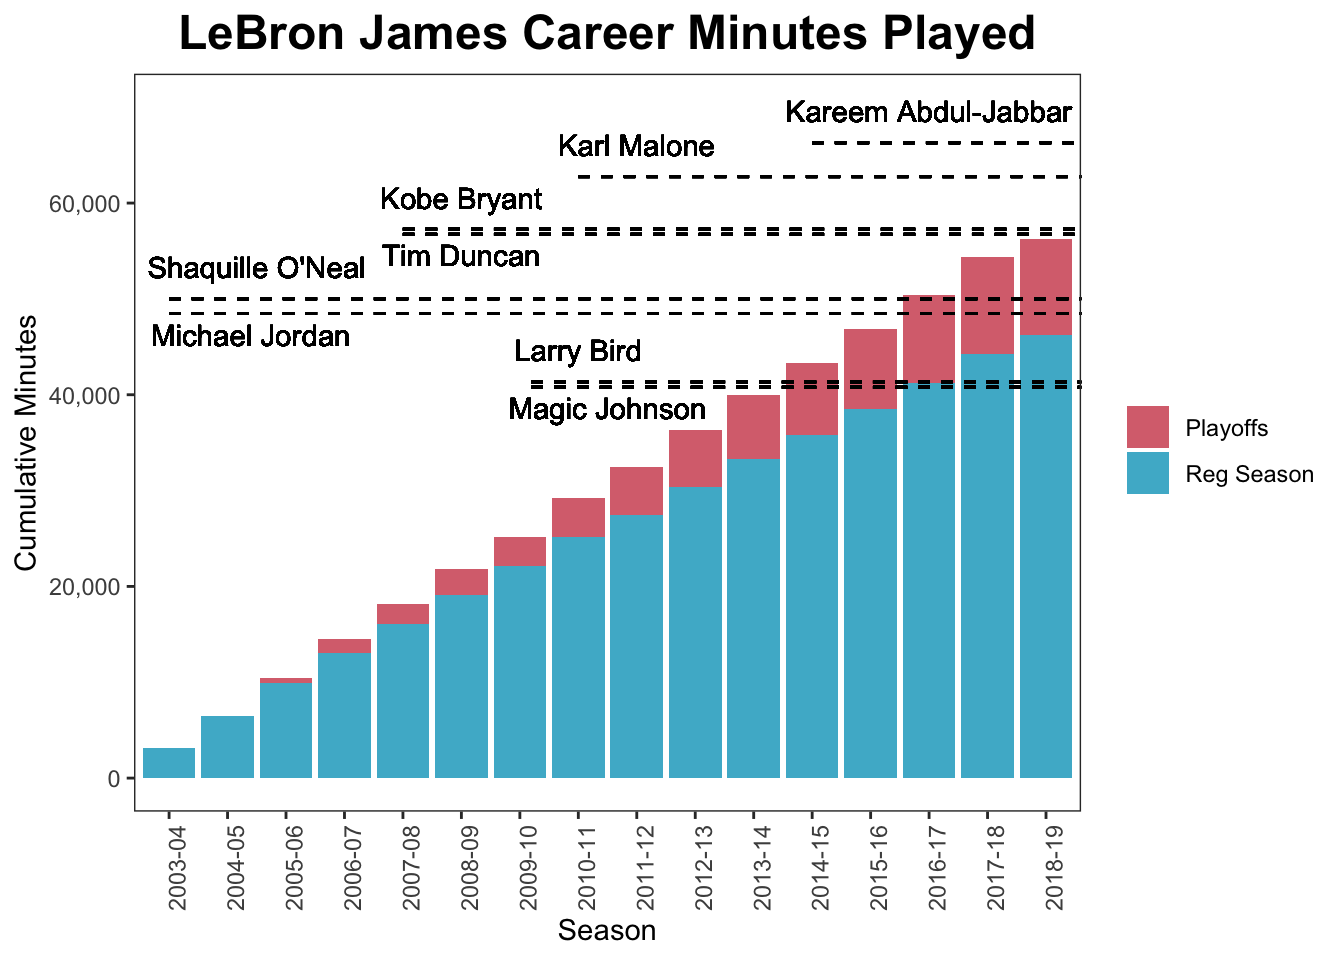
Code for complete plot
lbj_plt <- ggplot(df, aes(x = Season, y = MP, fill = RegPlayoffs)) +
  geom_bar(stat = "identity") +
  scale_fill_manual(values = c("#D9717D", "#4DB6D0")) +
  scale_y_continuous(label=comma, limits = c(0,70000)) +
  theme_bw() + #change the background colour to white
  theme(panel.grid.major = element_blank(), panel.grid.minor = element_blank(),
        axis.text.x = element_text(angle = 90),
        plot.title = element_text(size = 18, face = "bold", hjust = 0.5),
        legend.title = element_blank()
        )+
  ylab("Cumulative Minutes") +
  ggtitle("LeBron James Career Minutes Played") +
  geom_segment(x = 12, xend = 17, y=66297, yend = 66297, linetype="dashed") +
  geom_text(aes(14,66297,label = "Kareem Abdul-Jabbar", vjust = -1)) +
  geom_segment(x = 8, xend = 17, y = 62759, yend = 62759, linetype="dashed") +
  geom_text(aes(9,62759,label = "Karl Malone", vjust = -1)) +
  geom_segment(x = 5, xend = 17, y = 57278, yend = 57278, linetype="dashed") +
  geom_text(aes(6,57278,label = "Kobe Bryant", vjust = -1)) +
  geom_segment(x = 5, xend = 17, y = 56738, yend = 56738, linetype="dashed") +
  geom_text(aes(6,56738,label = "Tim Duncan", vjust = 1.5)) +
  geom_segment(x = 1, xend = 17, y = 50016, yend = 50016, linetype="dashed") +
  geom_text(aes(2.5,50016,label = "Shaquille O'Neal", vjust = -1)) +
  geom_segment(x = 1, xend = 17, y = 48485, yend = 48485, linetype="dashed") +
  geom_text(aes(2.4,48485,label = "Michael Jordan", vjust = 1.5)) +
  geom_segment(x = 7.2, xend = 17, y = 41329, yend = 41329, linetype="dashed") +
  geom_text(aes(8,41329,label = "Larry Bird", vjust = -1)) +
  geom_segment(x = 7.2, xend = 17, y = 40783, yend = 40783, linetype="dashed") +
  geom_text(aes(8.5,40783,label = "Magic Johnson", vjust = 1.5))
I did do some data manipulation to arrive at only these columns. More complete statistics for LeBron James’ career are in the lebron and lebron_playoffs data sets also contained in the gcubed package. The career totals for the other players in the plot were also sourced from their respective player pages on Basketball Reference.↩