Iris Data Set
Data
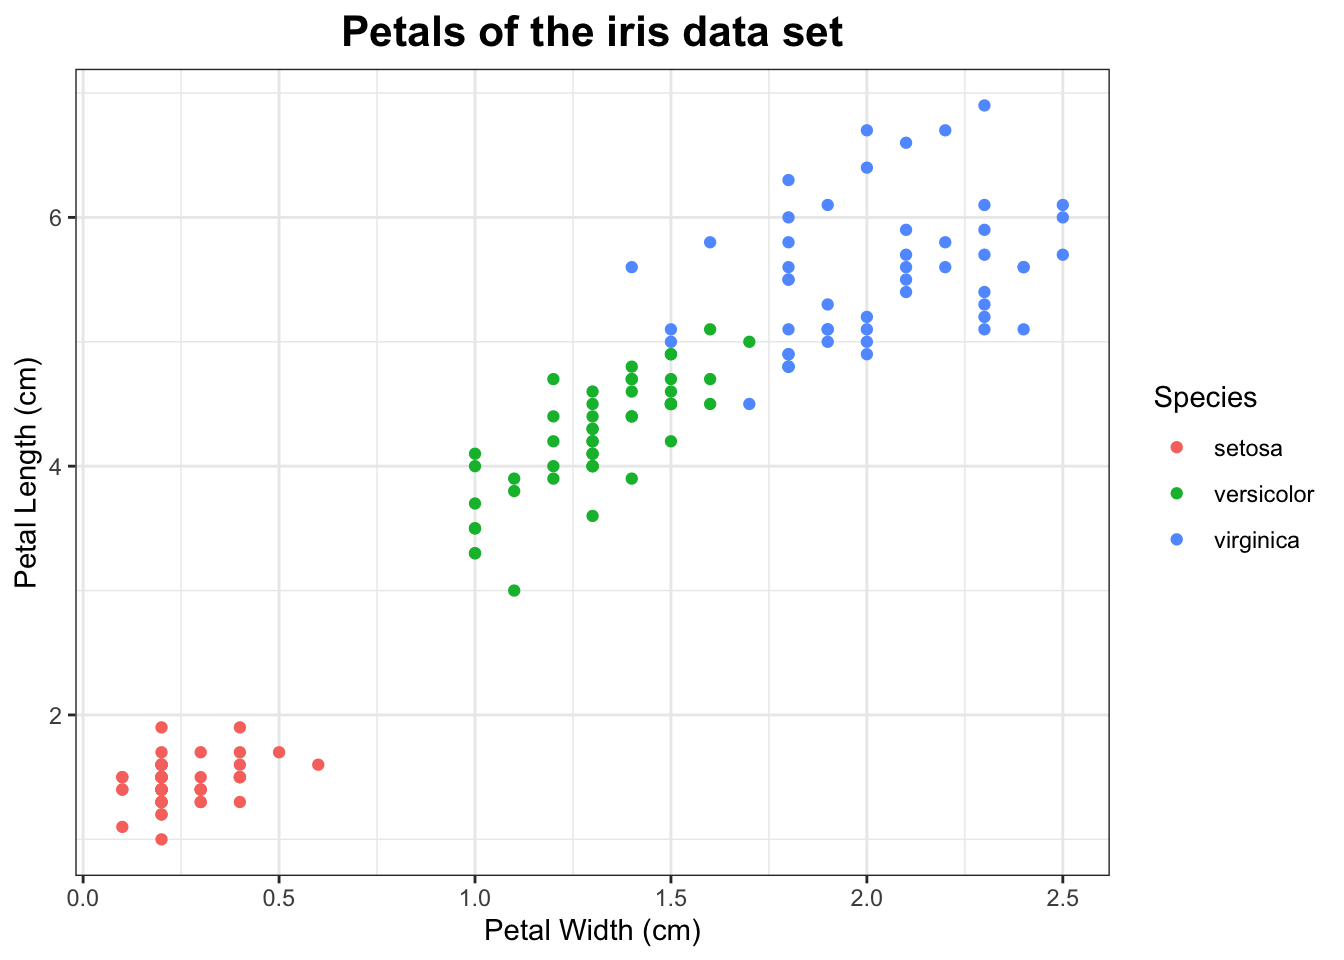
This plot uses the iris data set that comes with R. This data frame contains the widths and lengths of the petals and sepals of 150 iris flowers. The flowers are of three different species: setosa, versicolor and virginica. There are 50 specimens of each species.
The 1st, 51st and 101st rows look like:
iris[c(1,51,101), ]## Sepal.Length Sepal.Width Petal.Length Petal.Width Species
## 1 5.1 3.5 1.4 0.2 setosa
## 51 7.0 3.2 4.7 1.4 versicolor
## 101 6.3 3.3 6.0 2.5 virginicaCode for plot
To get this scatter plot, we use the geom_point geometry. To get the species coloured differently, the colour aesthetic is used and mapped to the Species variable.
library(ggplot2)

iris_petal_plot <- ggplot(data = iris, aes(x = Petal.Width, y = Petal.Length, colour = Species)) +
  geom_point() + theme_bw() +
  xlab("Petal Width (cm)") +
  ylab("Petal Length (cm)") +
  ggtitle("Petals of the iris data set") +
  theme(plot.title = element_text(size = 16, face = "bold", hjust = 0.5))

iris_petal_plot